

Key Takeaways
- Energy monitors show when and where electricity is consumed, not just how much per month.
- Whole-home monitors attach to your electrical panel; plug-in monitors track individual devices.
- Patterns in your data — not single readings — are what drive meaningful efficiency changes.
- Monitoring works best when paired with a room-by-room audit of your home's actual inefficiencies.
- Installation of whole-home monitors near your electrical panel may require a licensed electrician.
Start here
What Home Energy Monitoring Actually Does
Choose your tool
Types of Energy Monitors
Put data to work
How to Read and Use Your Data
Avoid mistakes
Common Pitfalls to Avoid
Keep improving
Next Steps After Your First Month
What Home Energy Monitoring Actually Does
Your monthly electricity bill tells you one number: total kilowatt-hours consumed. It cannot tell you whether your aging refrigerator is the biggest drain, whether your HVAC is short-cycling, or whether a device left on standby is quietly adding dollars to every statement. That is the gap home energy monitoring fills.
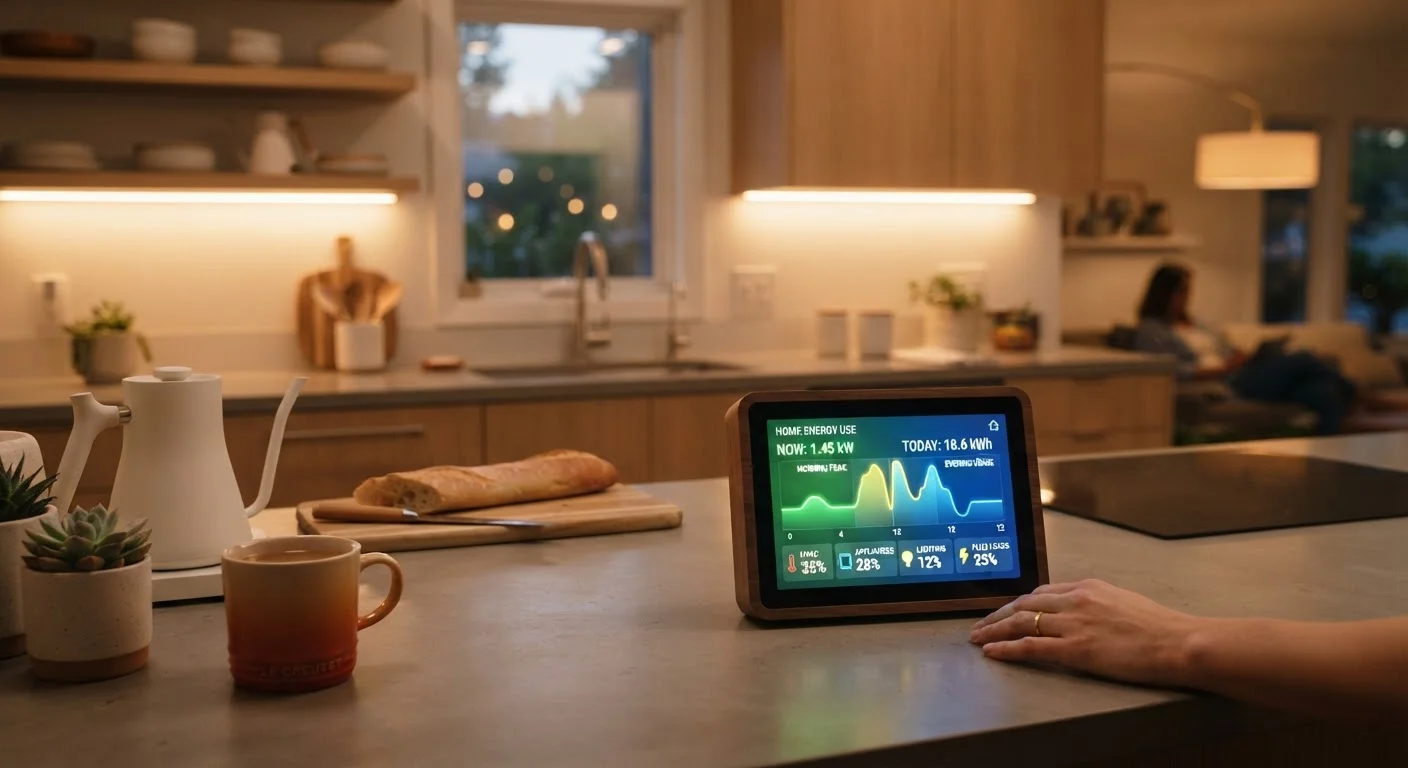
An energy monitor measures electrical current flowing through your home's circuits and translates it into readable consumption data — typically displayed on a companion app or web dashboard. Unlike a utility bill, a monitor can show you usage in near-real time, broken into hourly or even per-second snapshots. This granularity is what makes the data actionable. If you have ever wondered why your bills stay stubbornly high even after cutting back, a monitor is one of the most direct ways to find out.
Kilowatt-hour (kWh)
The standard unit of electrical energy your utility company bills you for. One kilowatt-hour equals one kilowatt of power consumed continuously for one hour — for example, a 100-watt bulb running for 10 hours.
Current transformer (CT)
A clamp-style sensor that fits around an electrical wire and measures the current passing through it without cutting or splicing the wire. Whole-home monitors use CTs to capture panel-level data.
Phantom load
Electricity consumed by a device that is switched off but still plugged in — often called standby power. TVs, game consoles, and chargers all draw some phantom load around the clock.
Disaggregation
A software technique used by some whole-home monitors to identify individual appliances within a combined usage signal by recognizing each device's unique pattern of power draw.
Time-of-use pricing
A utility billing structure where electricity costs more during high-demand periods (typically late afternoon and evening) and less during off-peak hours. Monitoring data can help you shift usage to cheaper windows.
Baseline consumption
Your household's minimum electrical draw when occupants are asleep or away and nothing is actively running. It represents the floor of your energy use and is a useful starting point for identifying waste.
Types of Energy Monitors
There are two broad categories of home energy monitors, and the right starting point depends on what you want to learn.
Whole-Home Monitors
These clip sensor clamps (called CTs) onto the main wires inside your electrical panel, measuring everything flowing into your home. They give you a complete picture of total consumption and can often distinguish individual high-draw appliances through a technique called disaggregation — recognizing each device's unique electrical signature. Installation involves working near live wires; assess your comfort level honestly, and call a licensed electrician if in doubt.
Plug-In and Smart Outlet Monitors
These fit between a device's power cord and the wall outlet. They are inexpensive, require no installation expertise, and are ideal for verifying the true draw of a specific appliance — a space heater, desktop computer, or older TV. The trade-off is that you only see what is plugged into that one outlet at a time.
Understanding how appliances are rated before you buy them can also help frame what your monitoring data means. Our guide on what energy efficiency ratings actually mean is a useful companion read.
How to Read and Use Your Data
Raw numbers are only useful when you know what to compare them against. Here is a practical framework:
- Establish a baseline. Run your monitor for at least two weeks without changing any habits. This gives you an honest picture of your current consumption pattern.
- Look for the peaks. Most dashboards show a timeline graph. Identify the hours with the highest consumption spikes — these often correspond to HVAC startup, electric water heating, or cooking.
- Identify always-on load. The minimum draw you see at 3 a.m. — when nothing should be active — is your baseline phantom load. Devices on standby, networking equipment, and older appliances all contribute.
- Change one variable at a time. Turn off or unplug a suspected energy hog for a week and compare. Changing multiple things simultaneously makes it impossible to isolate causes.
Pairing this data with a room-by-room efficiency audit will help you translate what you see in the numbers into specific physical fixes around your home.
Start with two weeks of honest baseline data
Resist the urge to change habits as soon as you install a monitor. Let it record your normal behavior for at least 14 days first. A baseline built on altered behavior gives you a distorted starting point, making it harder to measure genuine progress later.
Common Pitfalls to Avoid
Energy monitoring is straightforward, but a few missteps consistently trip up first-timers.
- Ignoring the data after setup. Many households install a monitor, check it twice, and forget it. Build a habit of a weekly five-minute review — patterns only become visible over time.
- Expecting the monitor to act. A monitor is purely diagnostic. It shows you what is happening; acting on that information is still your job.
- Over-indexing on small devices. It can feel satisfying to unplug phone chargers, but these draw trivial amounts. Focus first on the highest-wattage devices: HVAC systems, water heaters, clothes dryers, and electric ovens.
- Skipping privacy settings. Cloud-connected monitors log detailed behavioral data. Review your app's privacy and data-sharing settings before enabling any optional features.
If you are considering going further with automated controls, it is worth reading a balanced overview of home automation for efficiency before committing to any system.
Next Steps After Your First Month
After four weeks of data, most households have enough information to take concrete action. A few practical directions:
- Address the highest always-on loads first — they deliver the steadiest returns because they run continuously.
- Schedule high-draw tasks (laundry, dishwasher) for off-peak hours if your utility offers time-of-use pricing.
- Use your baseline data to set a realistic reduction target for the following month, then compare.
- Before each heating or cooling season, revisit your monitor data alongside a seasonal efficiency checklist to catch new inefficiencies before they compound.
Energy monitoring is not a one-time project. It is most valuable as an ongoing reference — especially after major changes like a new appliance, a renovation, or a change in household size. The data you collect becomes a living record of how your home actually uses energy, which is far more useful than any estimate or average.
This article is for general informational purposes only. Electrical work carries risk of injury; consult a licensed electrician for any installation you are not fully confident performing safely. Verify local permit and code requirements before modifying any home electrical system.